My context was mostly "zooming" time. Like power-of-ten zooms of size, but for time. Or timelapses. So a single rendered moment, represents an aggregate of some extent of time. Say you're linearly scrubbing over a 10 kyr span, made of 100 steps. Then each step summarizes a 100 yr extent, with all its heterogeneity. Similarly for a span of 100 yr of 1 yr steps, or 100 Myr span of 1 Myr steps. How might one do that well, gracefully handling the heterogeneity?Now educational graphics are notorious for negative training. Some aspect is done carefully perhaps, but others less so, and a menagerie misconceptions are reinforced. Some solar system introductions for example, start with such a wretched graphic, which so reinforces many common misconceptions, that even before you hit the text, you've dug a net-negative learning hole that you're never going to climb out of. Many readers would understand the topic better if they'd never seen the page.
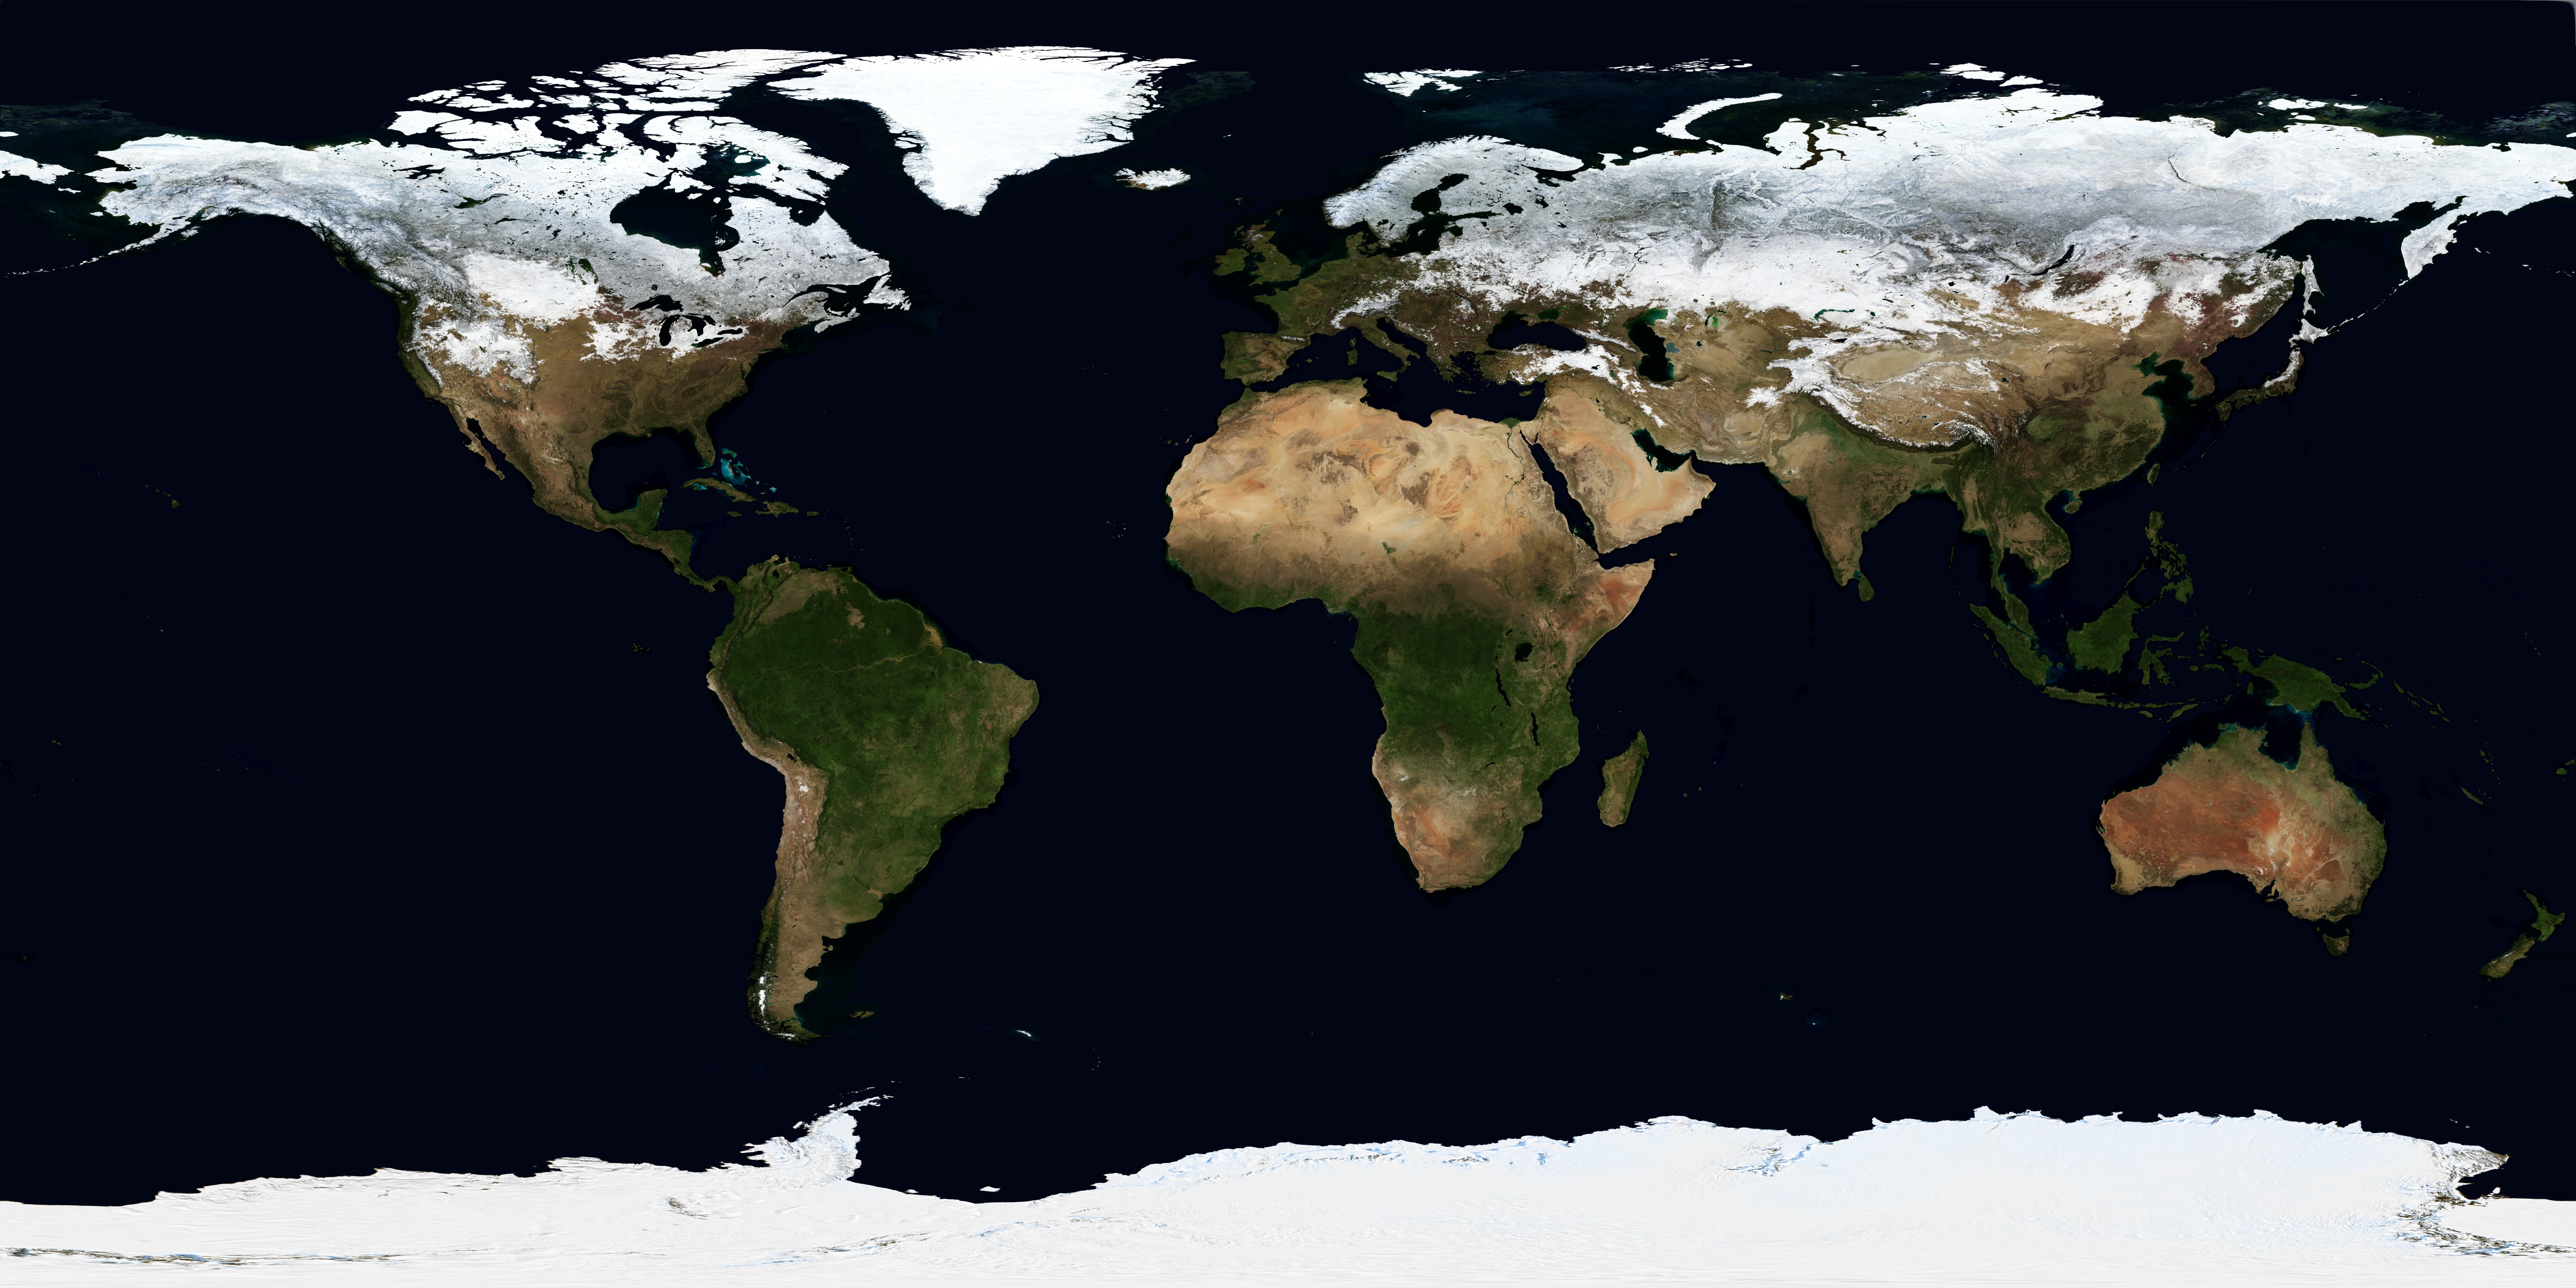
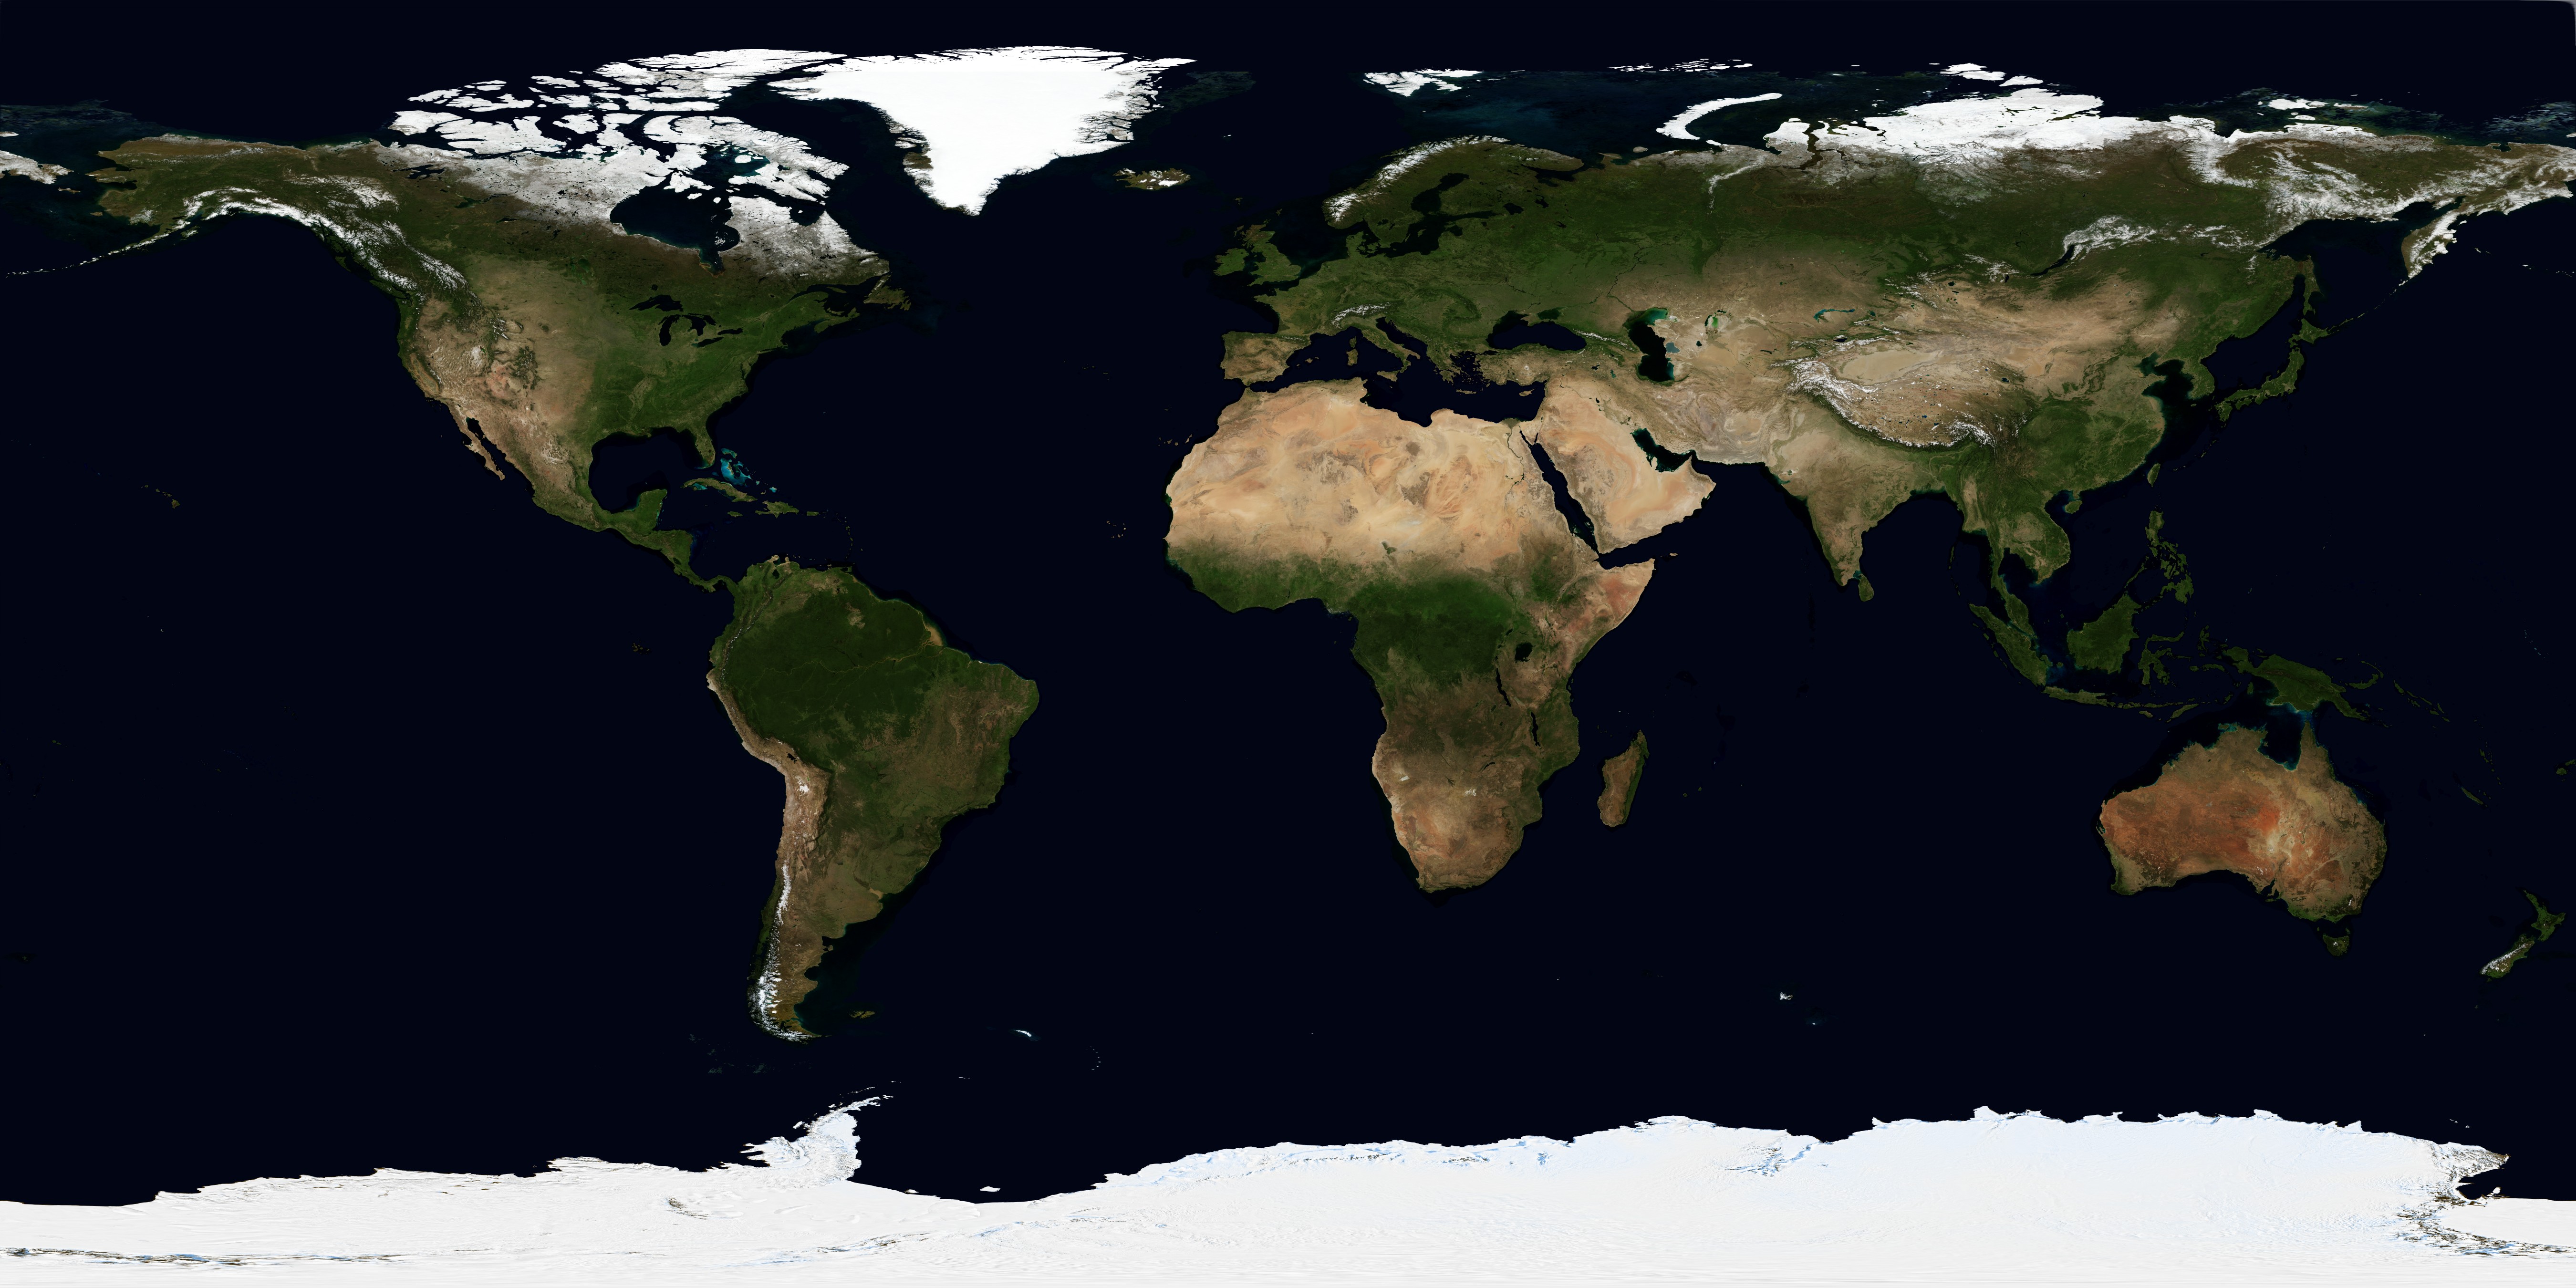
Raising a general question: in what ways might we render an Earth globe, that gracefully aggregates/summaries some extent of time? How do you handle things that varied during that time? Diverse clouds, day/night, diversity of seasons, diversity of years, climate changes and sea levels and ice ages, moving continents and paleoclimates. An extent of some mere 10s of Myr encompasses west antarctic as both temperate rainforest and arctic tundra - so what might one paint, to represent west antarctica over that extent as a whole?
So I was taking advantage of your post, to raise a general question which has long puzzled me.
Thanks for sharing your nice work.